Vida Enigmática

"Who speaks for Earth?"

Who speaks for Earth?

atmosphere Australia biodiversity buying case climate climate change consumerism don't Earth environment environmental extinction food home humanity know Leslie Dean Brown life Mars materials money natural nature oxygen part planet power products reason rich science scientific scientists sustainable technology tell thing trees value want water what work world

Webdesign by thelastpistachio.com
Logo by logobrain. All rights reserved © 2025.

Climate change in Moruya, NSW, Australia.

September 11, 2017 — leslie dean brown

So today I thought I’d share this graph of my nearest weather station in NSW, Australia (well, the second-nearest weather station, because the closest one only has data since the beginning of 2000).

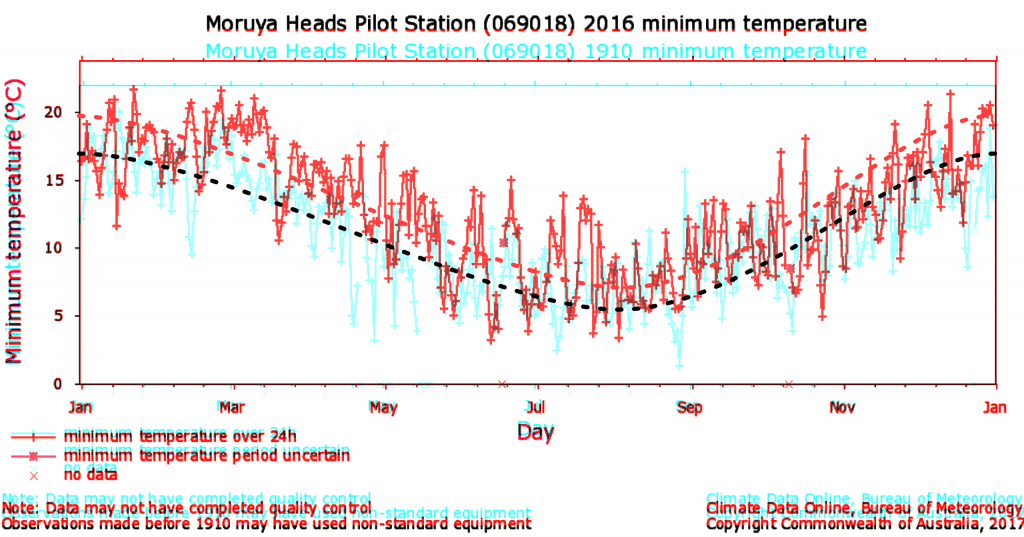
And here it is. Data is from the Australian government Bureau of Meteorology. Moruya heads pilot station. Minimum daily temperatures from 1910 superimpsed with data from 2016. The first year of data compared to the last full year of data. Graphs have been rescaled in the y-axis so that they line up (if they used a consistent scale I wouldn’t have to do this; I think it auto-scales).

Now I have roughly superimposed my own “line of best fit” through both curves (they are both the same height at the beginning and end, as they should be). Yes I eyeballed it. But you can clearly see that the red line is well above the blue line pretty much everywhere.

Now I know this doesn’t “prove” anything because it’s just one weather station of many. And some years are hotter due to the El Niño effect (according to google, both 1900-1901 and 2015-2016 were El Niño periods). But I was curious about something and so I thought I’d personally check it out. [I was originally looking up this very warm day we had on the 3rd of September, 2017 because it was 9°C above average]

Note:

I’ve seen other graphs where people draw their line of best fit and the end tangents don’t match for January and December. I don’t think that is technically correct, because we are looking at continuous trends from month to month and year to year. Where we take the yearly ‘chunk’ of data is kind of irrelevant.

I’ll give you an example: you wouldn’t expect that the temperature for January of 2017 to be significantly different than December of 2016. Likewise, you wouldn’t expect the temperature for December of 2015 to be significantly different than January of 2016. Indeed, we could include these two extra months if we wanted to and look at a 14 month span instead of a 12 month span. But if someone has drawn a wacky curve at the start and finish, and then we include the extra adjoining months, we see that it would be completely wrong.

Therefore, I have inserted the line of best fit through the data so that it matches up at both the start and end of the year. I inserted the minimum number of nodal points (three) and they are ‘symmetrical’. That way, we can expect the temperature fluctuations to continue on from one to the next year and precedes from the last one (without a huge slope at the beginning or end).

Why are scientists fanatical about climate change?

September 10, 2017 — leslie dean brown

Yes we certainly do become a bit fanatical. Why? Why is that? Let’s take a look:

Because the basic hypothesis here is is that our actions directly affect our environment. It really is that simple. It’s no different than pouring a tonne of cyanide into a lake. What do you think is going to happen? Fish will die is what will happen. Likewise, modern technology can and does have the potential to affect the atmosphere. You can either accept it or you can bury your head in the sand like an ostrich.

I think a lot of people don’t get the connection between the vibration of countless tiny molecules and temperature. That’s why I like to share this information.

When you study science, you soon learn that scientists must be open minded. A closed-minded scientist is all but useless. What good would it do a scientist if their own personal belief systems got in the way of their research? Can you imagine if I “didn’t believe” that fluorine gas reacts violently with potassium? So I go to the chemical laboratory and proceed to mix 4kg of potassium with 100 moles of fluorine gas, “just for fun”, because I “believe” nothing is going to happen. That would be a very dangerous personal belief. Right?

A scientist can take a look at new data and go “oh okay, that’s news to me.” You’ve now changed his outlook and it has only taken a few minutes/hours. But it has taken the rest of the world THREE DECADES to catch up. THREE DECADES! And still you have people who don’t believe there is a correlation.

It truly baffles me. I think the denial has NOTHING to do with carbon dioxide vs temperature and it has EVERYTHING to do with people’s lifestyles and careers.

Why don’t you deny atomic charges? Or electromagnetism theory? Or molecular bonding? No. You cherry pick the parts of science you want to agree with and to hell with the rest of it (most likely because you drive a car and you want to *continue* driving it).

Did you know that it actually takes more time to become a science doctor than a medical doctor? It took me nine years of full time study. Where is the respect? For many people, there isn’t any. And it probably takes close to two whole decades to become a professor… these are *very* knowledgeable people.

So, yes. Yes we do become a bit fanatical. We become fanatical because the fossil fuel industry even knows it to be true, but they don’t do anything! We become fanatical because you have people like googly-eyed “Lord Monckton” claiming they know what they are talking about when in reality they are totally scamming people.

The sky does not go on forever

August 31, 2017 — leslie dean brown

Motripalmas by Emanuel Mårdsjö
“Motripalmas” by Emanuel Mårdsjö, © 2012-2017.

I think during the daytime we think that the blue sky goes on forever. Like in this amazing artwork by Emanuel Mårdsjö.

But if the Earth’s atmosphere was converted into a solid, it would be only 12.2 metres thick. The rest is the freezing cold empty vacuum of space.

Not all opinions are equal.

August 29, 2017 — leslie dean brown

A much closer look at confederate statues:

August 19, 2017 — leslie dean brown

Upon closer inspection, this is what a conferederate statue looks like. It’s the metal, magnified a hundred times:

Why are statues so important to some people? Honestly. It doesn’t actually ‘repreresent’ anything either, does it? It’s what the sculptor chose to ‘represent’. He could have equally constructed a cube standing up on one edge to represent the past.

When I look at this statue (albeit a pictorial replication on the internet), I see bronze metal that has developed a green patina. It’s sort of in the shape of a horse. With a man riding it. And a hat. I don’t see so many monuments with the riders wearing hats. Is the hat what makes it important? :-/

If you were to look at this monument closer in real life, much closer, under a microscope say, you wouldn’t see an effigy of Robert Edward Lee. You wouldn’t see any flesh and blood. You wouldn’t see his soul or anything else. You wouldn’t see anything to do with the history of slavery or Charlottesville. Or Virginia. Or anything to do with confederate-anything.

What would you see? You’d only see the metallic grains of the original alloying elements, copper and tin. Even underneath the patina, polished back to its original lustre, it’d look a lot like this under the microscope. A bit like the featured image above.

Right?

In other words, in material terms, it has bugger all true value. Well maybe it’s worth US$2 to 3 per pound. Here.

That sculpture is also going to disappear anyway in a few million years. What possible difference does it make now?

Why would you want to honor a statue about slavery? Why?!

Well that is my perspective on confederate statues. [Read more…]

  • « Previous Page
  • 1
  • …
  • 12
  • 13
  • 14
  • 15
  • 16
  • …
  • 71
  • Next Page »